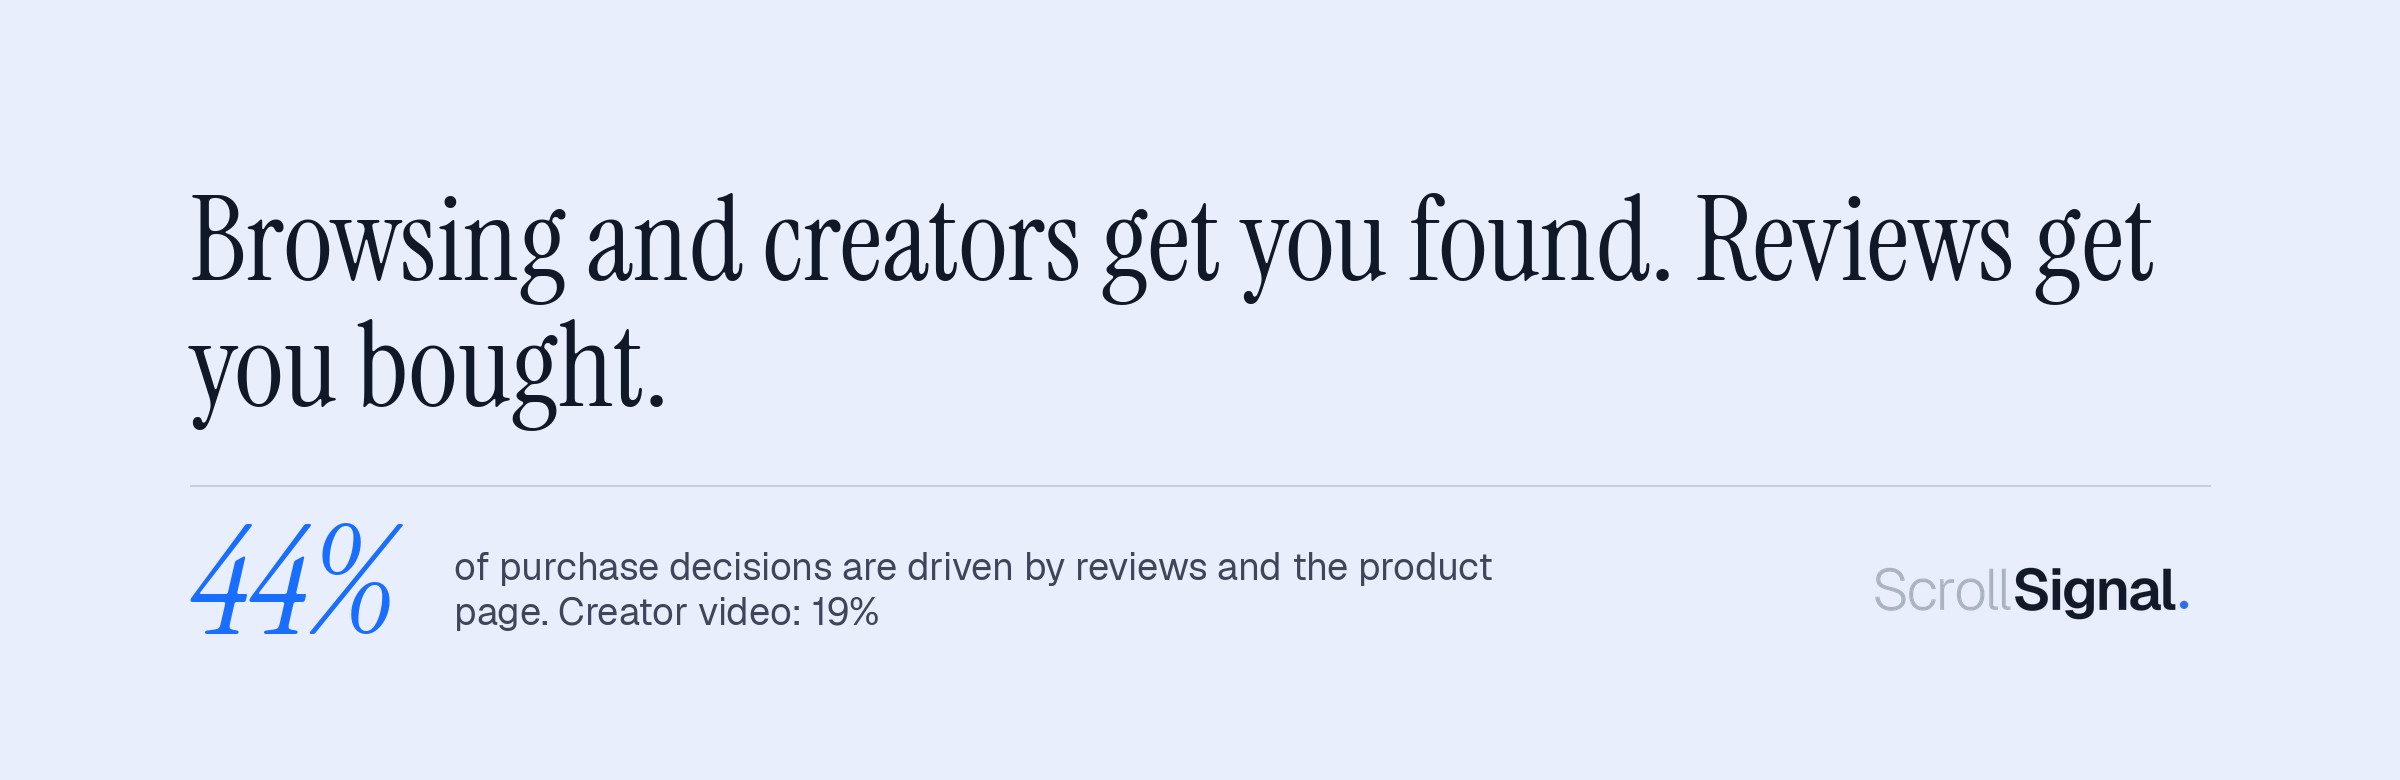
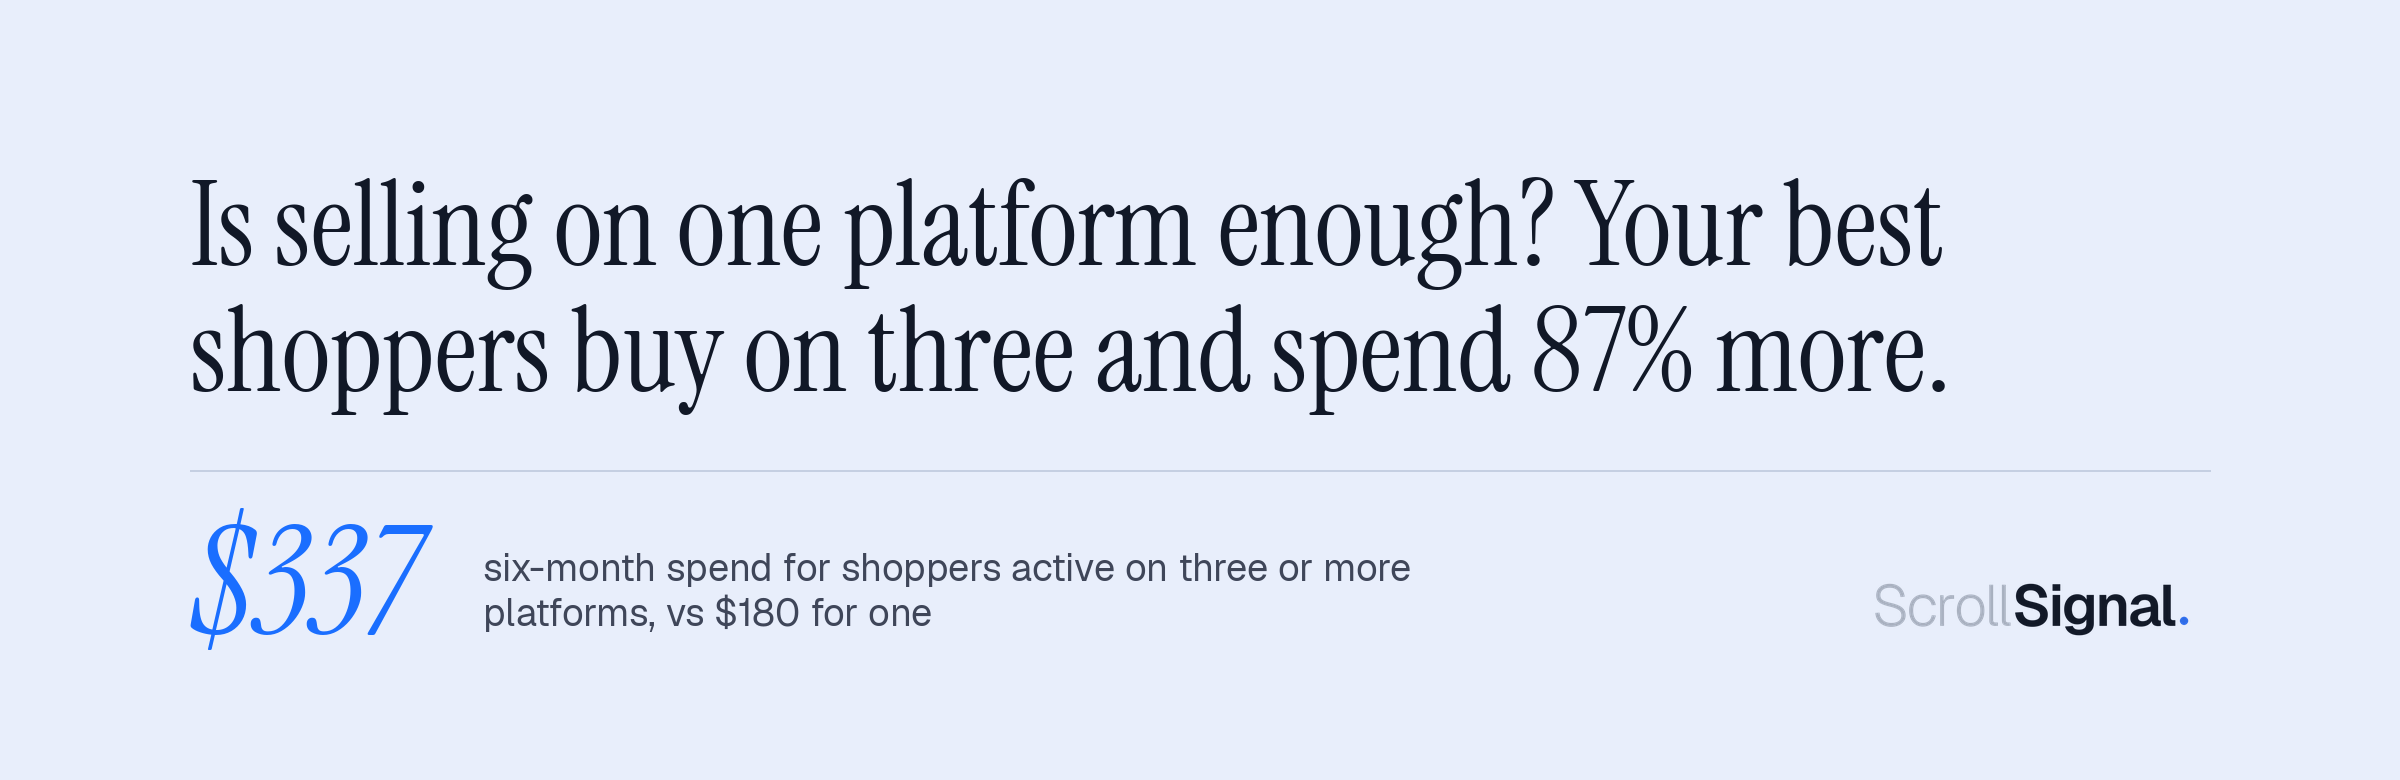
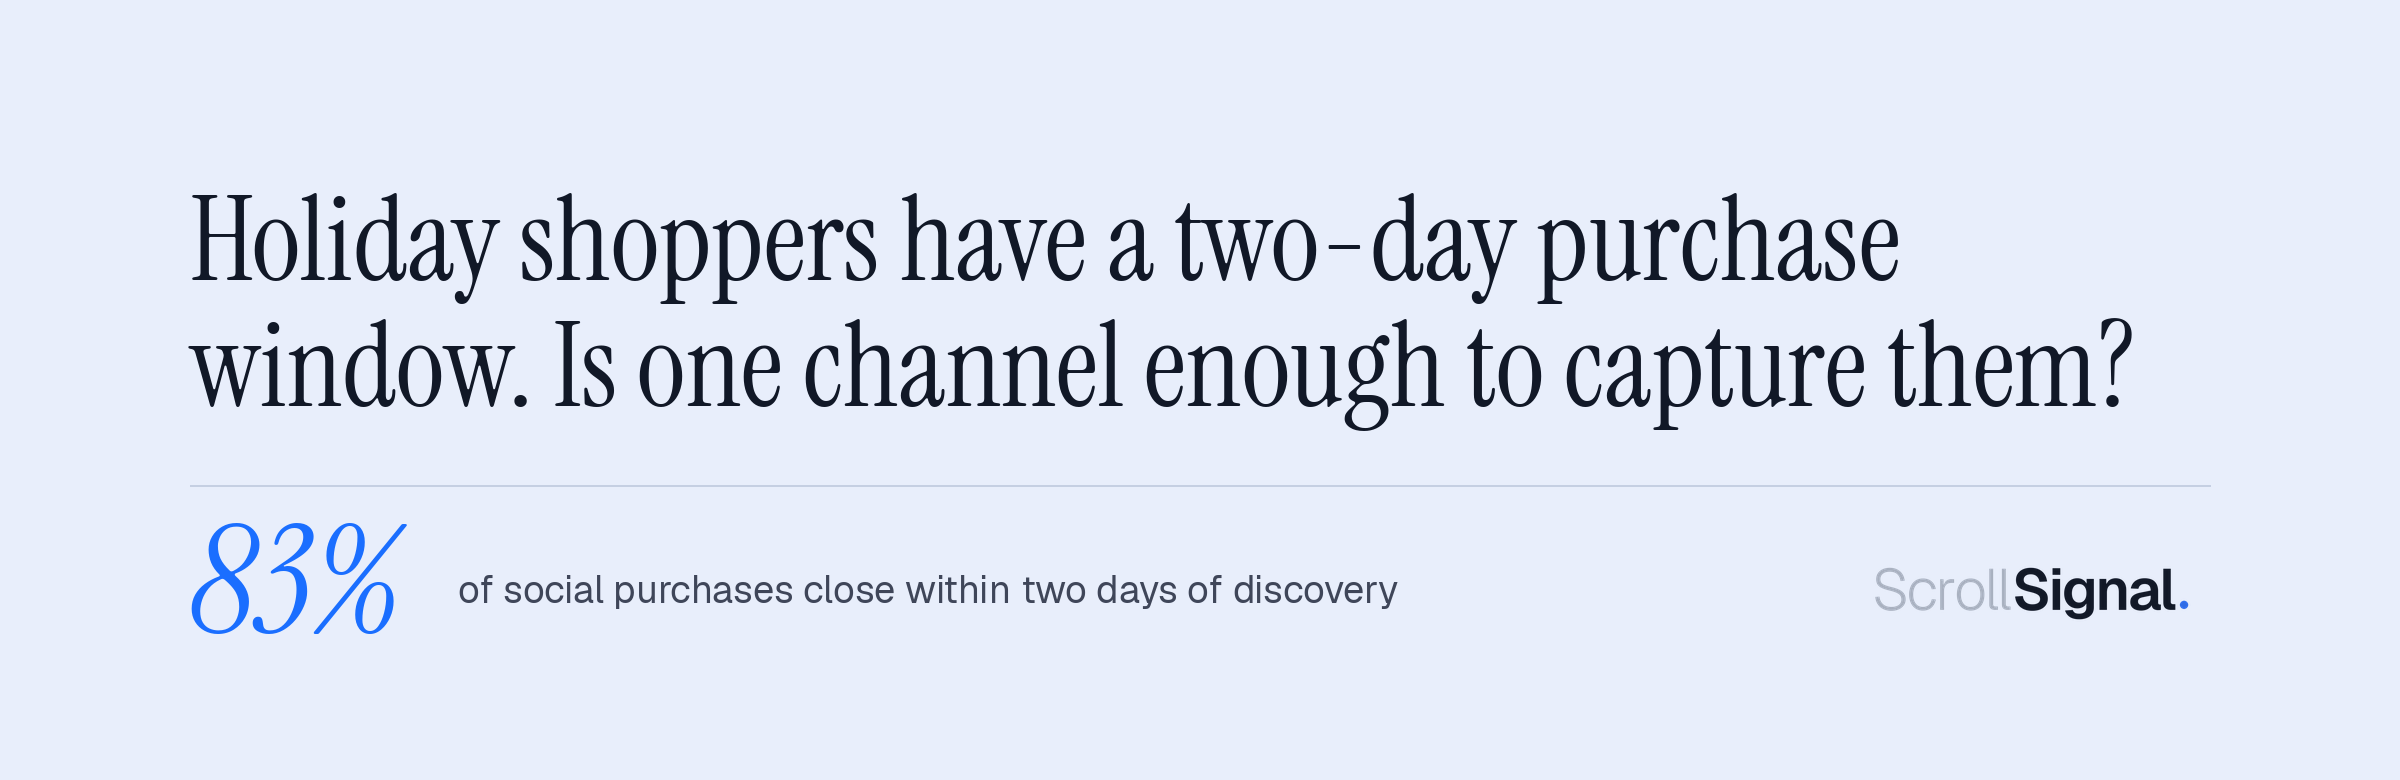
Shoppers want trust three times more than a lower price.

Independent research on how 1,000 US shoppers actually buy on TikTok, Instagram, Facebook, YouTube, and Pinterest. New findings every week, free.

Get the research first · Subscribe free

Prefer the highlights? Download the free executive summary.

n=1,000 US shoppers · stratified to Census · no platform funding

New research, every week.

Very satisfied shoppers plan to buy again at three times the rate of the merely satisfied, 59 percent versus 21 percent.
Research Brief · No. 05

The Trust Imperative.

The last purchase decides the next one. Very satisfied shoppers buy again at three times the rate of the merely satisfied.

The social commerce buyer is 35 to 44, not Gen Z.
Research Brief · No. 04

The Age Inversion.

On spend and repurchase intent, the social commerce buyer is 35 to 44, not Gen Z.

Shoppers name trust three times more often than lower prices, yet spend most on the platforms they trust least.
Research Brief · No. 03

The Social Commerce Trust Gap.

Shoppers name trust three times more often than lower prices, yet spend heavily on the platforms they trust least.

All insights and data answers →

Most social commerce research
is built to sell ad inventory.
Ours is built to inform budget decisions.

Original consumer surveys · No platform funding · Cross-platform benchmarks

Four principles that govern every report we publish.

01

No platform funding

We do not accept money, sponsorship, data partnerships, or in-kind support from any social platform. Our findings cannot be bought.

02

Original consumer surveys

Every finding starts with real consumers answering real questions. We do not republish secondary research or platform-supplied estimates.

03

Methodology in the open

Sample size, screening, quotas, and question wording are published with every report. You can evaluate the work without buying it.

04

Findings, not opinions

We report what the data shows, including findings inconvenient for the platforms or for the brands buying the work. The data is the product.

Social Commerce
Intelligence Report
2026

What 1,000 US social commerce buyers reveal about which platforms they trust, how they discover products, where purchases complete, and what would make them buy more.

Platform-vs-platform benchmarks across TikTok, Instagram, Facebook, YouTube, and Pinterest. No platform funding. No outside agenda.

Free Executive Summary → View the Report
  • 01The Speed-Trust Paradox — how shoppers buy on platforms they don't fully trust. The impulse window, the trust-share gap, and the in-app advantage.
  • 02Who's Actually Spending — the cohorts driving social commerce, not who you think. The 35–44 power cohort, the parent premium, and the platform income map.
  • 03The Trust Imperative — what limits spend today, and what unlocks more. What trust actually means, the live commerce gap, and the satisfaction loop.

Three themes · Nine signals · Strategic implications

Built for the people making the call on where to invest.

Brand marketers

CMOs, brand strategy leads, and digital commerce directors evaluating where to put media and merchandising spend across social platforms.

Agencies and consultancies

Strategy, planning, and account leads who need defensible benchmarks to bring into client conversations and pitch decks.

Investors and analysts

VC, growth equity, and public market analysts modeling social commerce platforms, brands, and the picks-and-shovels around them.

The Signal. New findings every week, free.

Subscribe →